PydTfinder
PydTfinder is a cutting-edge and user-friendly tool that makes it easy to pinpoint the precise temperature and pressure points where phase transitions occur in your system. If you're working with Hydrate-Liquid-Vapor (HLV) equilibrium systems, PydTfinder is the perfect tool to help you find the exact equilibrium point of interest you need. By utilizing a temperature difference input and a highly accurate polynomial regression algorithm, PydTfinder is able to identify the precise points of phase transition with pinpoint accuracy. This powerful tool also offers a wide range of customization options, including manual input, csv file input, output type, degree of regression, number of points displayed in the plot, and directory location of the csv file, allowing you to tailor the tool to your specific needs. For researchers, engineers, and scientists working in the field of thermodynamics, phase equilibrium, and phase transition, PydTfinder is an essential tool that will save you time and increase your productivity.
Features
- Plot the phase equilibrium data and the regression line
- Also plot the parallel line according to the temperature difference (ΔT value)
- Input options include
manualinput or input from acsvfile - Allows for adjusting the degree of the regression (the higher the degree, the more accurate the regression) and the number of points displayed in the plot
- Output options include
png,pdf,svg, andepsfile types
Dependencies
pandasargparsepyfiglettabulatematplotlibnumpysklearn
Installation
pip install pydtfinderor
pip3 install pydtfinderUninstallation
pip uninstall pydtfinderor
pip3 uninstall pydtfinderUsage
The tool can be run using the command line
pydtfinder -hOptional arguments
| Argument | Short form | Default | Description |
|---|---|---|---|
--input_type | -it | manual | The type of P, T input. The options are: manual, csv |
--delta_t | -dt | 5 | The temperature difference between the two curves in K |
--degree | -g | 5 | The degree of the regression; the higher the degree, the more accurate the regression |
--num_point | -n | 10 | The number of points that will be expressed in the plot |
--output | -o | png | The file type of the output file. The options are: png, pdf, svg, and eps |
--directory | -d | "./" | The directory location of the csv file |
--legend | -l | "Your Phase EQ input" | The legend title of your Phase EQ input data |
--version | -v | Show the version of the tool |
Examples
(1) Manual input
PydTfinder can handle the manual input data from user.
Input
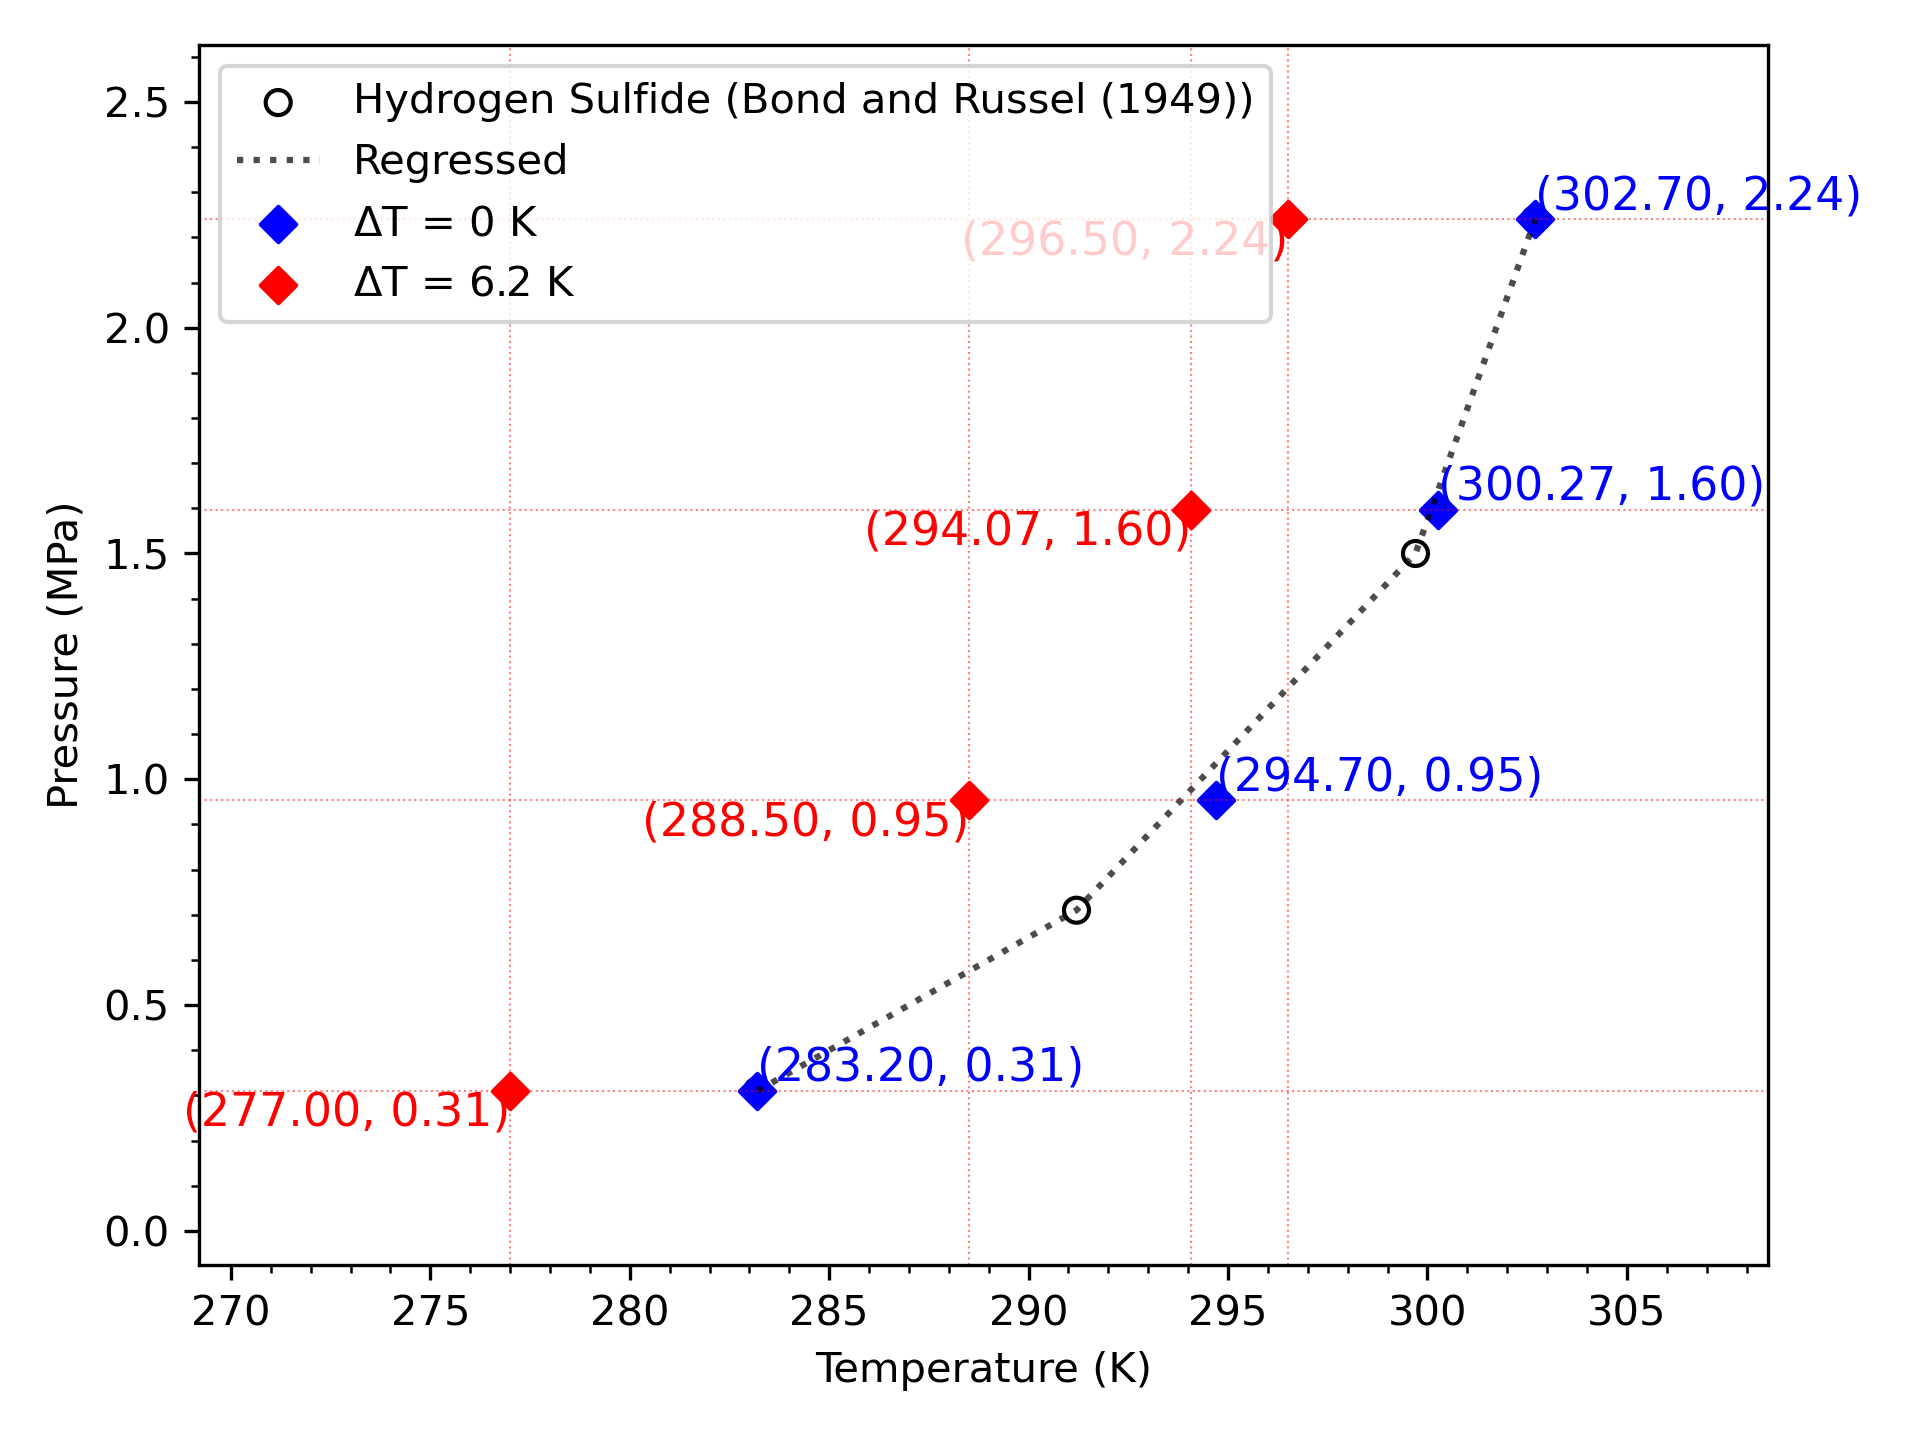
pydtfinder -it manual -dt 6.2 -g 3 -n 4 -o png -l "Hydrogen Sulfide (Bond and Russel (1949))"PydTfinder exhibited the below messages and plot.
Output
INFO Please enter the TEMPERATURE values (K) separated by comma: 283.2, 291.2, 299.7, 302.7
INFO Please enter the PRESSURE values (MPa) separated by comma: 0.310, 0.710, 1.496, 2.241
INFO The input temperature values are:  [283.2, 291.2, 299.7, 302.7] [unit: K]
INFO The input pressure values are:  [0.31, 0.71, 1.5, 2.24] [unit: MPa]
INFO Your desired temperature at 0.31 MPa is 277.00 K (T = 283.20 K - ΔT = 6.20 K)
INFO Your desired temperature at 0.95 MPa is 288.50 K (T = 294.70 K - ΔT = 6.20 K)
INFO Your desired temperature at 1.60 MPa is 294.07 K (T = 300.27 K - ΔT = 6.20 K)
INFO Your desired temperature at 2.24 MPa is 296.50 K (T = 302.70 K - ΔT = 6.20 K)


INFO The figure is saved as "PLOT_DeltaT=6.2K_Deg=3_NP=4_Legend="Hydrogen Sulfide (Bond and Russel (1949))".png"
Plot (Manual input)
(2) CSV input
PydTfinder can also handle the .csv file data from user.
Input
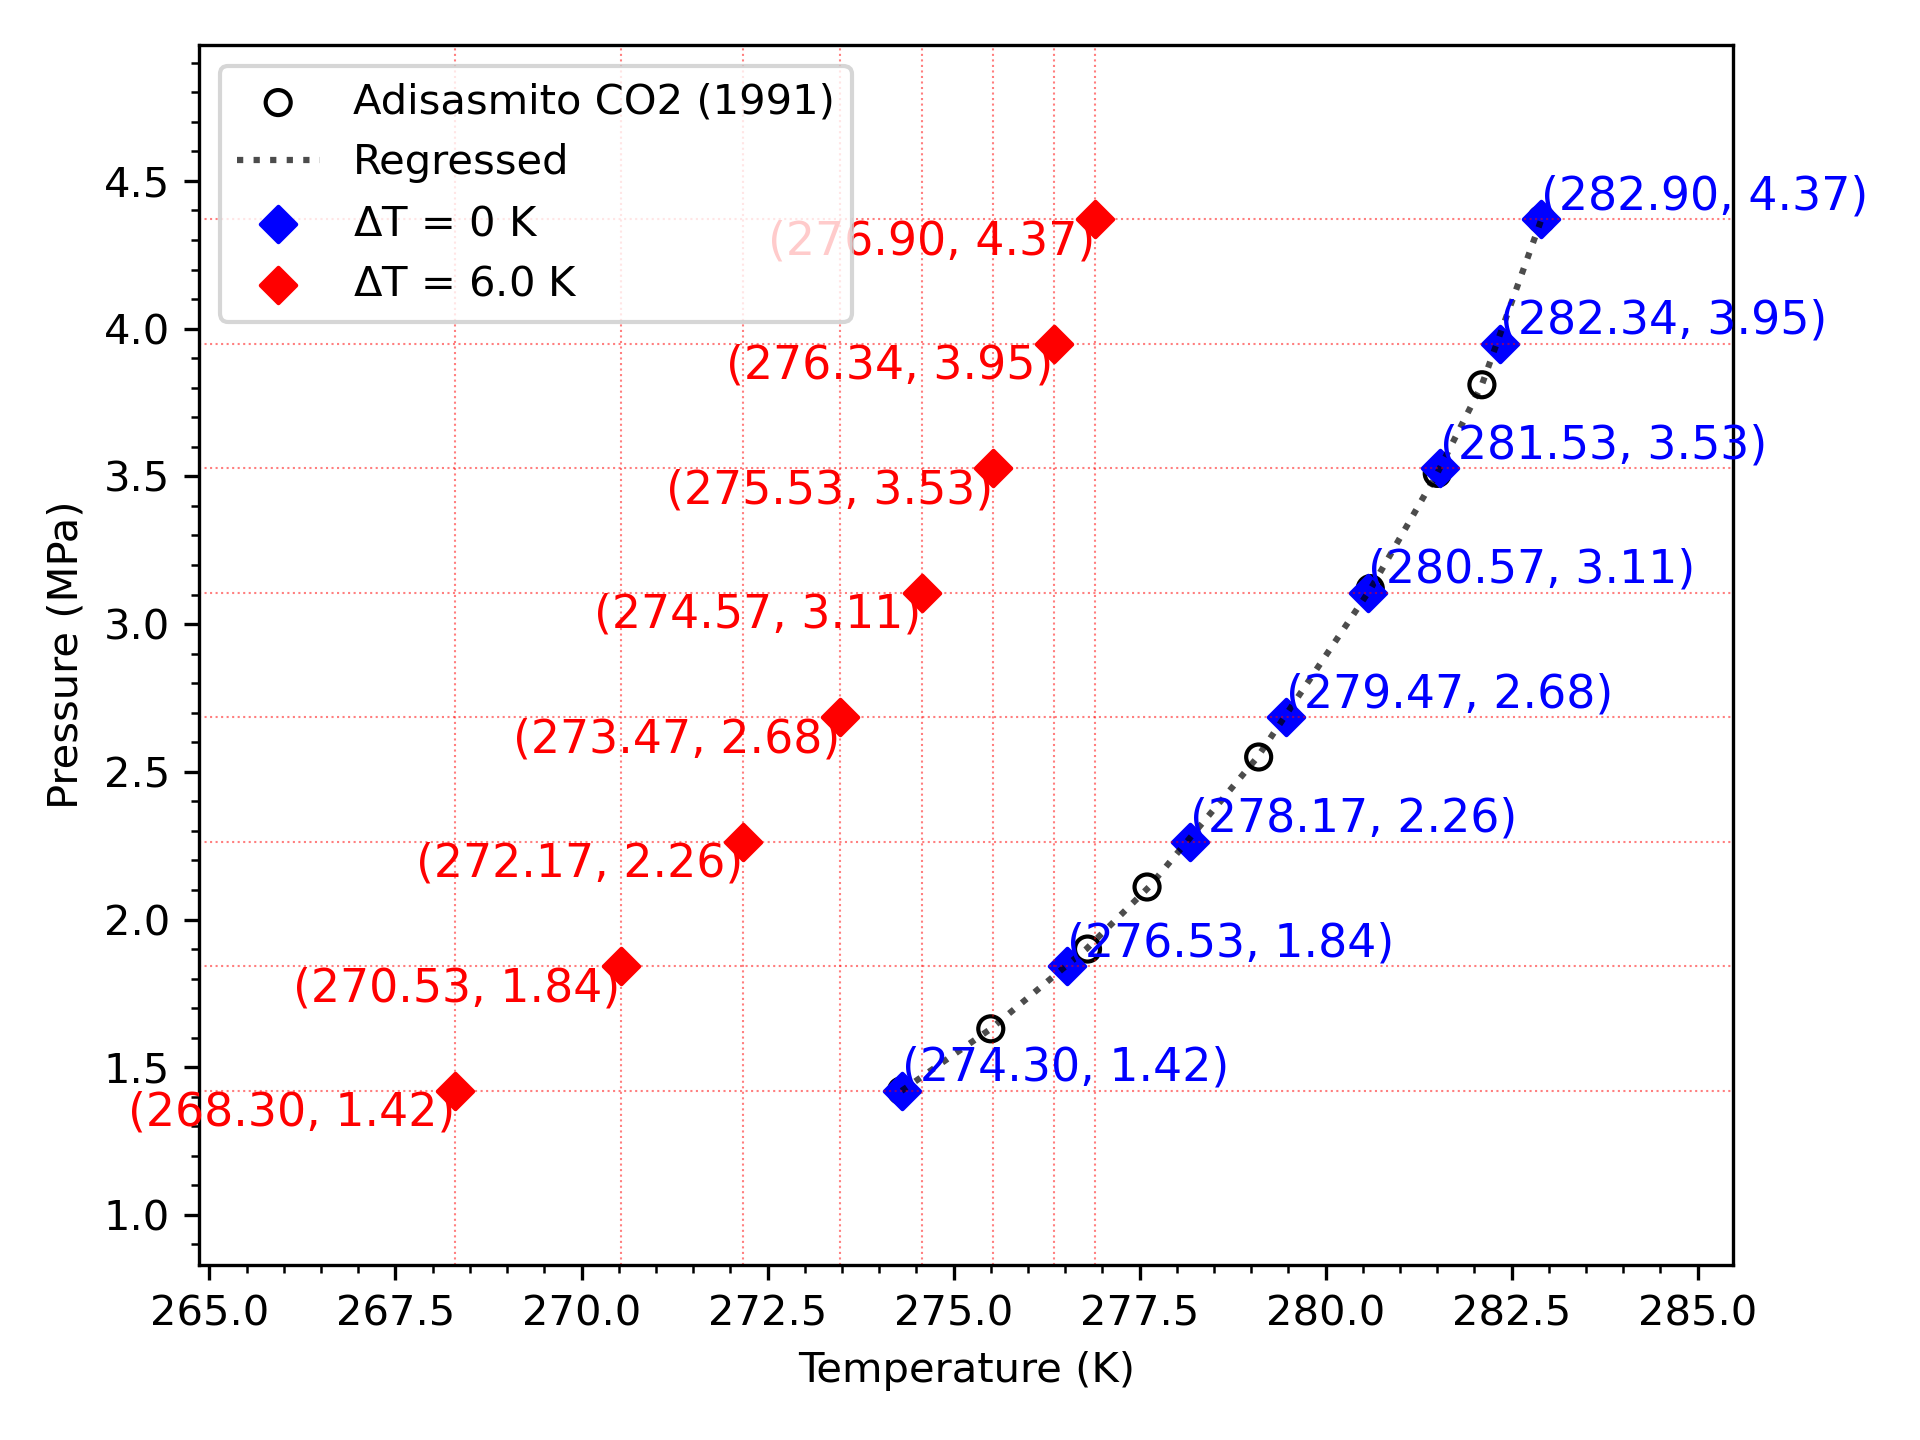
pydtfinder -it csv -dt 6.0 -g 4 -n 8 -o pdf -d ./ -l "Adisasmito CO2 (1991)"PydTfinder exhibited the below messages and plot. Output
+---------------+-----------------------------+
|   File number | File name                   |
|---------------+-----------------------------|
|             0 | ./Adisasmito CO2 (1991).csv |
+---------------+-----------------------------+
INFO These are the files that are in the folder. Please type the file number that you want to use: 0
INFO The file name that would be utilized is ./Adisasmito CO2 (1991).csv
INFO The input temperature values are:  [274.3, 275.5, 276.8, 277.6, 279.1, 280.6, 281.5, 282.1, 282.9] [unit: K]
INFO The input pressure values are:  [1.42, 1.63, 1.9, 2.11, 2.55, 3.12, 3.51, 3.81, 4.37] [unit: MPa]
INFO Your desired temperature at 1.42 MPa is 268.30 K (T = 274.30 K - ΔT = 6.00 K)
INFO Your desired temperature at 1.84 MPa is 270.53 K (T = 276.53 K - ΔT = 6.00 K)
INFO Your desired temperature at 2.26 MPa is 272.17 K (T = 278.17 K - ΔT = 6.00 K)
INFO Your desired temperature at 2.68 MPa is 273.47 K (T = 279.47 K - ΔT = 6.00 K)
INFO Your desired temperature at 3.11 MPa is 274.57 K (T = 280.57 K - ΔT = 6.00 K)
INFO Your desired temperature at 3.53 MPa is 275.53 K (T = 281.53 K - ΔT = 6.00 K)
INFO Your desired temperature at 3.95 MPa is 276.34 K (T = 282.34 K - ΔT = 6.00 K)
INFO Your desired temperature at 4.37 MPa is 276.90 K (T = 282.90 K - ΔT = 6.00 K)


INFO The figure is saved as "PLOT_DeltaT=6.0K_Deg=4_NP=8_Legend="Adisasmito CO2 (1991)".png"
Plot (CSV input)
Contact
If you have any questions or suggestions, please visit the GitHub repository at https://github.com/wjgoarxiv/pydtfinder for more information.
License
This project is licensed under the MIT License. See the LICENSE file for details.
Pull requests
Pull requests are welcome. For major changes, please open an issue first to discuss what you would like to change.
EXTRAS
EXTRA 1: For advanced users
Automate your process! Get multiple plots at once!
By utilizing the shell script, you can get multiple plots at once. I've prepared the example shell script in the PydTfinder/run_examples/advanced_usage/ folder. Download the automation_script_example.sh. Consecutively, authorize it to be executable by typing the below command in the terminal.
chmod +x automation_script_example.shThen, you can run the shell script by typing the below command in the terminal.
./automation_script_example.shAutomation results
In the demo run, the Patil C3H8 (1987).csv file was used.
Output
You can see that the shell script generated multiple plots at once.
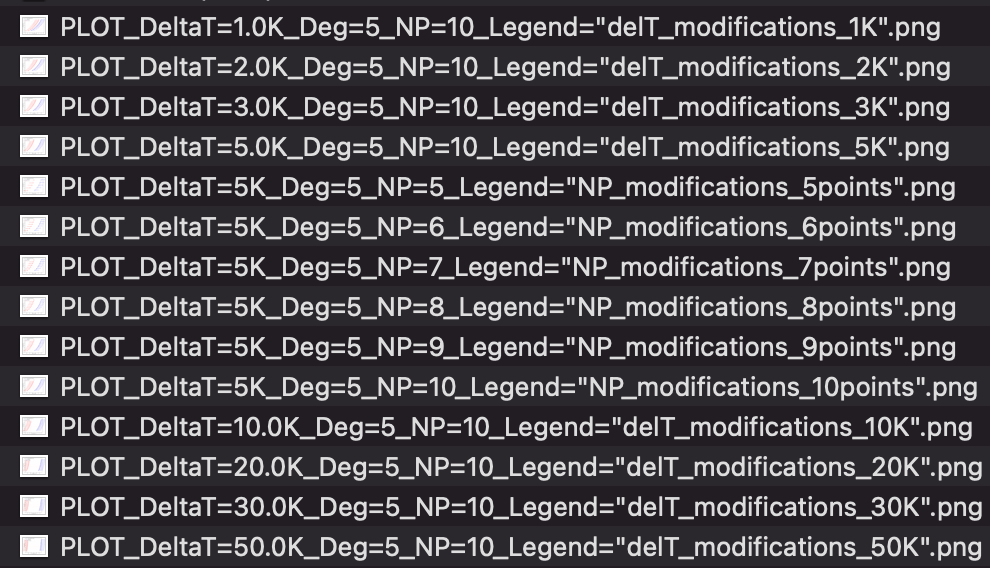
See the generated images in here.
EXTRA 2: How did I make moving gifs?

The recipe I made the moving gifs is:

#!/bin/bash
convert $(ls *.png | sort -V) -delay 1 forward.gif;
gifsicle --unoptimize forward.gif forward.gif "#-0-1" > composition.gif
Before you run that, you will need to type
brew install ImageMagickand
brew install gifsicle